Data Reader for Macintosh
If you want my honest opinion, just go get GraphClick, which is much better than DataReader, better supported and free.
Introduction
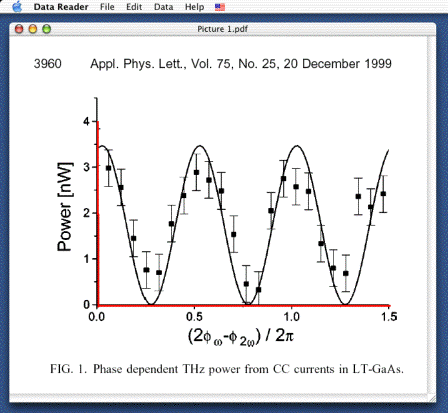
Data Reader is a scientific application that allows you to read the data from a graph and export to an ASCII file for further processing. For instance, if you have a graph in digital format (e.g. a PICT file containing a digitized version of a figure or a screen capture of a figure in a publication), you can extract the data using Data Reader to use it in in a spreadsheet. Do not forget that you must always acknowledge the author(s) when using data that is not originally yours.
It is available for Macintosh only and was tested on MacOS X, but should work fine on any system from 8.5.x I think. The 68k version and the Classic versions are not updated anymore. You can download the latest version from the following link:
Data Reader 1.6.1 Carbon.dmg
Data Reader 1.6 Carbon.sit
These older versions are still available:
Data Reader 1.3 Classic
Data Reader 1.3 68k
You require the latest version of Stuffit Expander to decompress it.
I welcome suggestions and bug reports at
dccote@novajo.ca.
Send me an email if you want to be informed of new releases.
How does it work ?
- Obtain a digitized version of the graph of interest. If you have the graph on paper, you can simply digitize it with a scanner. If the graph is in a publication that is available electronically (e.g. PDF), you can open it and use the screen capture key-combination on the Macintosh (shift-command-3 and shift-command-4 on MacOS 9 and later, including OS X) to capture a PDF/TIFF/PICT file of the screen. The best format is PDF on OS X, but any other format that Quicktime can read be fine ( GIF, PNG, TIFF, SGI, BMP, JPEG, to name a few). If you do not have Quicktime, you can only open PICT files.
- Once the file is open, set the X and Y axes. By default, they are set along the left and bottom edge of the window, which is highly likely not what you want. Select either one axis in the data menu. A check mark appears on the left of the menu item, indicating that you can now click, hold and drag the mouse in the window to indicate where the axis is (minimum to maximum). Repeat the operation for the other axis. If the picture is larger than the window, scroll bars will be present. Dragging outside the window will scroll to that position.

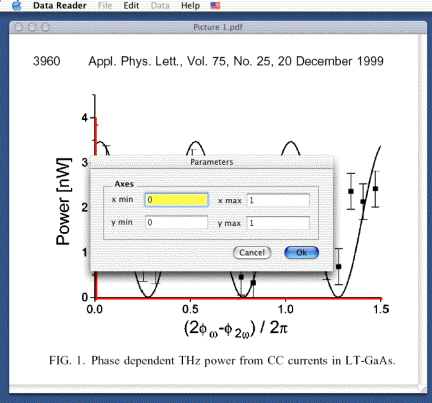
- You can set the scale in the Parameters section of the Data menu. The X and Y minima and maxima are used to scale the data to the appropriate values when exporting. The default is 0 to 1, which simply means that your data is normalized.

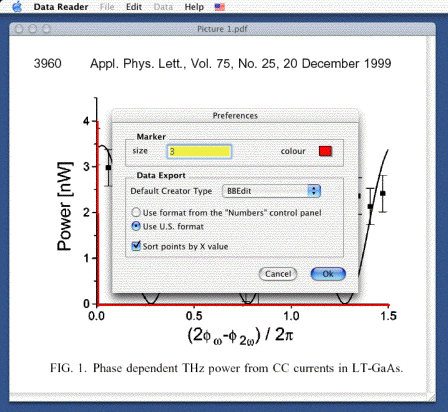
- Other preferences are accessible in the Preferences menu (the Apple Menu on OS X, the Edit menu on OS 9).

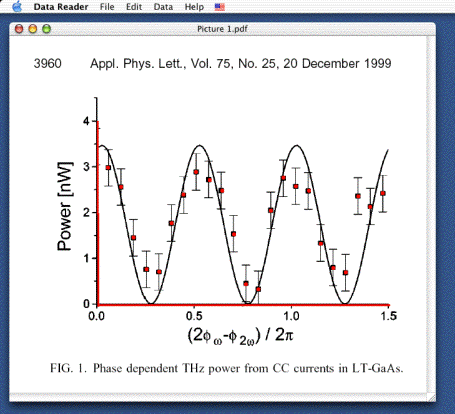
- Click on the points on the graph. The point is set when you let go of the mouse button. You can drag the point around, you can also drag it outside the window to scroll. If you want to remove the last point, select Undo in the edit menu. If you want to remove all points, select Clear from the edit menu.

- When done, select the Export item from the Data menu. Select a file name. By default, the name will be the name of the graphic file with ".dat" appended. The creator of the file is set to your choice in the Preferences, but you can open it with anything that reads text files.
How much does it cost ?
Data Reader is $10 shareware. You can register online if you wish at Kagi's secure web site. You can also use the Register program that accompanies Data Reader. Enter your name, your email address and the number of single user licenses you desire for each program you wish to purchase. Save or Copy or Print the data from the Register program and send the data and payment to Kagi. More specifics on the Register program to follow. Kagi handles my payment processing.
If paying with Credit Card, you can email or fax the data to Kagi. Their email address is sales@kagi.com and their fax number is +1 510 652-6589. You can either Copy the data from Register and paste into the body of an email message or you can Save the
data to a file and you can attach that file to an email message. There is no need to compress the data file, it's already pretty small. If you have a fax modem, just Print the data to the Kagi fax number.
Payments sent via email are processed within 3 to 4 days. You will receive an email acknowledgement when it is processed. Payments sent via fax take up to 10 days and if you provide a correct internet email address you will receive an email acknowledgement.
If you are paying with Cash or USD Check you should print the data using the Register application and send it to the address shown on the form, which is:
Kagi
1442-A Walnut Street #392-ZTP
Berkeley, California 94709-1405
USA
You can pay with a wide variety of cash from different countries but at present if you pay via check, it must be a check drawn in US Dollars. Kagi cannot accept checks in other currencies, the conversion rate for non-USD checks is around USD 15 per check and that is just not practical.
If you have a purchasing department, you can enter all the data into the Register program and then select Invoice as your payment method. Print three copies of the form and send it to your accounts payable people. You might want to highlight the line that mentions that they must include a copy of the form with their payment.
Kagi can not invoice your company, you need to act on my behalf and generate the invoice and handle all the paperwork on your end.
Please do not fax or email payment forms that indicate Cash, Check or Invoice as the payment method. As far as we know, there is still no technology to transfer physical objects via fax or email and without the payment, the form cannot be processed.
Payments send via postal mail take time to reach Kagi and then up to 10 days for processing. Again, if you include a correct email address, you will hear from Kagi when the form is processed.
History
October 2003
Version 1.6
- Corrected interface.
- Added the possibility of scroll when dragging points.
- Corrected a bug where axes would be incorrectly set when view was scrolled.
- Added possibility of using humongous files (more than 16 000 pixels wide).
- Can now read PDF files (i.e. Mac OS X screenshots).
September 2000
Version 1.3
- Now really uses Quicktime for opening files when it is available. If you do not have Quicktime, you can still open files other than PICT if you have Translation set to automatic in the File Exchange Control Panel (MacOS 9) or Macintosh Easy Open on other systems.
- No more popup in the Open... dialog since anyway you were restricted to one item.
- The axes are now automatically set to the left and bottom of the picture after opening. Not necessarily what you want but better than the top-left corner (i.e. what it used to be).
- Carbon version made available.
August 2000
Version 1.2.1
- On opening, window is resized to fit the graph.
- Parameters can be set to any numbers (scientific notation or not). The formatting used is obtained from the Numbers Control Panel.
- Export now writes number in full precision. It also uses the Numbers Control Panel Settings. If you cannot import your data into a spreadsheet, it might be because you are not using the U.S. number format which is very often required by spreadsheet programs. Switch your settings to U.S.
Version 1.2
- Unlimited undo implemented for points and axis setting.
- Redo menu added with command-shift shortcut using Mercutio.
- Added default button in dialogs
Version 1.1
- Undo feature implemented (for points only).
Version 1.0
Known Features/Bugs
- Error management is pretty primitive. It will catch important errors, but will not tell you what happened (don't you hate that ?).
- You will not receive a warning if you close the window before exporting your data. Be warned.
- It sometimes happens that opening a file fails (when conversion is required). When it does, you end up with an empty window. Close it, there is nothing to do with it.
Road Map
Several things could/will eventually be added to the program:
- Better error management.
- MacOS help file.
- A preference window to select the default application for the text file that is exported.
- Copy the points to the clipboard for pasting into other applications.
- A selection mechanism to allow you to move the points with arrow keys and delete several points at once.
- A grid to lock the X value to a specific interval.
- A open/save option to make your life easier.
Who made it ?
I am a Ph.D. student in quantum optics/condensed matter who got tired
of reading data points on a graph with a ruler, a pen and a piece of paper.
Daniel Cote
dccote@novajo.ca
http://www.novajo.ca/datareader/
Legal Matter
Mercutio MDEF from Digital Alchemy,
copyright © Ramon M. Felciano 1992-
1997, All Rights Reserved.
CVersCaption ©1997-1998 John C. Daub. All rights reserved.
Thanks to Brett Wood for his CMultipleUndoer class.
No warranties expressed or implied. If you do not like that, just don't use it.


